All camera/lens systems vignette the produced images, some much more than others. Vignetting (or more-correctly light falloff as we're discussing here), the darkening of the created image toward the edges, is caused by a number of factors. We are so used to seeing vignetting in images, we usually don't notice it; in fact many think that vignetting can add to the appeal of an image and will add more in during post-processing. Vignetting in some applications is not desirable: scientific and technical images, cartographic images, repro work, and panorama stitching are among the applications where vignetting is to be avoided.

In this image, the upper left portion is a flat evenly-lit surface showing the effects of vignetting causing light fall-off radiating from the center. It becomes noticeable when compared to the true flat field uniform gray half of the image in the lower right.
We're going to take a look at a couple of options for eliminating or reducing vignetting in images during post-processing, particularly using the
fulla command available in the free
hugin panorama photo stitcher package. The fulla command is a useful utility we'll explore for other purposes in future posts, as well as using it to address vignetting here.
Before we get started, a couple of things need to be understood. First, vignette characteristics are unique to a particular camera,lens, focal length, and aperture. Change any one of those and the vignette characteristics change. The rate of brightness falloff from center to edges of an image is not uniform; systems that may cause the same center-to-edge brightness falloff may do it in very different ways. It can happen in a gradual linear way or it may have relatively uniform brightness until getting closer to the edges when it drops of quickly. Vignetting is not necessarily radially symmetrical, although in most cases it is close enough for our purposes in this discussion. Finally, this overview is not for the faint of heart; it outlines the non-obvious aspects of what we're doing but if you wish to pursue this yourself, you must be willing to dig in and work through the details yourself.
Using a flat field image as a corrective for other images is a technique that has been around a long time and is still commonly used by astrophotographers. Essentially, you shoot an image of a perfectly uniform empty subject devoid of any detail and uniformly lit from edge to edge. A clear cloudless haze-free sky directly overhead would be an example. You then apply this image to target images using software that cancels out the brightness differences represented in the flat field image. The advantage to this approach is that you are directly using the systems recorded image to cancel out the brightness anomalies in the produced images. The fulla command can use a flat-field image to correct for vignetting by passing the flat-field image's name as a command option.
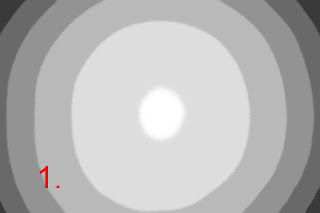
The trouble comes when you try to produce an accurate flat-field image for your camera, particularly if you aren't doing this for a telephoto lens. It's actually fiendishly difficult to get the featureless uniformly-lit subject you need to do this. The gray image above is an attempt to produce such a flat-field image (upper left portion) using the Canon G9 camera's 7.4 mm focal length and f/2.8 aperture. This is a relatively wide angle (about 50° on the long side), presenting quite a challenge for coming up with a suitable flat-field subject. I was not successful—I came close but never could get an image in which all corners were consistent, for example.
Another approach is to correct the vignetting mathematically. You provide a formula to software that can use to determine what brightness correction should be used at each radial distance from the center of the image. The fulla command provides 2 options for doing this, one in which you provide the formula for the value that should be added to the brightness depending on radial distance, the other method uses a correction in which the brightness is divided by a value provided by a formula. I found the latter worked better for me. The fulla command has very sparse and nearly unusable documentation so I'll fill in the details as I describe the process I used to profile my camera system for vignette correction.
The net result of what we're going to do is to provide a set of 4 numbers to a fulla option that describe an equation fulla uses to determine what adjustment needs to be made at each radial distance in the image. The four numbers are coefficients for an even-powered 6th order polynomial of the following form:
a + b * r2 + c * r4 + d * r6
where
r is the radius from the center of the image (0) to the farthest corner (1.0). This formula is applied at each radial distance by dividing the image's RGB values by the calculated factor to determine what the new adjusted values should be. Assuming you haven't left already, our job is to find the values for a, b, c, and d that work best for the particular camera, lens, focal length, and aperture we're interested in correcting.
The first step is to measure the brightness fall-off from the center to the corners of an image produced by your system. Because there's so much trouble trying to get a single flat-field image, we'll shoot multiple images of a uniformly-lit small target, panning the camera from the center to a corner between shots. Our goal is to get about 15 or 20 shots of the target ranging in position from the center to the lower right corner of the image.
I used a gray card illuminated by an incandescent lamp that was turned on about 20 minutes before starting to make sure the light has stabilized. The camera was mounted on a tripod about 15 feet away and set on the focal length and aperture I wanted to profile (7.4 mm at f/2.8 for this example). I adjusted the tripod head so the camera was angled to the left in such a way that I could pan over the subject from the center to the lower left corner without adjusting anything else on the camera. Then I made the series of about 20 shots panning a little more to the left each time until I had images of the target all the way into the farthest reaches of the corner. I made sure I was using manual exposure and the target was approximately gray (midrange) in value. By the way, I was shooting raw, not JPEG, as I didn't want the internal JPEG processing mucking up the precision of my test images.
Next step is process the images precisely how you would normally do it. Do not apply any contrast adjustments to the images unless you use exactly the same adjustments on all your images all the time. I ended up generating about 20 TIFF files that I could load in sequence into Photoshop to sample the brightness of the target at each position.
Next use your Photoshop (or other) eyedropper tool to measure the same relative location of your target in each image. I used the 5X5 averaging for more uniform readings. Record the location in the image that you sample (x and y values) and the readout of the brightness (either the green channel, for example, or gray value if you converted the images to grayscale during processing).
Plug these into a spreadsheet and start crunching the numbers into something more meaningful. First, you want to convert the x and y values into a radius value ranging from 0 at the center to 1.0 at the far corner. The Canon G9 I used makes images 4000 X 3000 so the spreadsheet formula for finding the radius based on x and y readings goes something like this:
=sqrt(($Xn-2000)^2+($Yn-1500)^2)/2500
where X and Y are, obviously whatever column numbers you used to plug in your x and y coordinate numbers.
Next, create a column of your radius numbers squared—this will be used in determining the magic coefficient numbers we're after.
Finally, create a column of normalized brightness levels. At this point you need to decide how you want to correct your image's brightness levels for vignetting. You could brighten the darker outer region, darken the lighter central region, or do something in between. I took the in-between route to minimize the damage I'm doing to pixels that are having their brightness adjusted. So, my normalized brightness values are calculated by dividing the recorded brightness value by the average of the brightest and darkest values. This would give you a range of numbers going from a little over 1.0 to a little less than 1.0 depending on how bad the vignetting is. For my f/2.8 test images, the brightest central reading was 153 and the darkest corner reading was 129 giving me a normalized range of 1.085 to 0.915, approximately.
Next we calculate a polynomial regression line through the values we've calculated. If you are using an Excel spreadsheet, this is easy. Create a XY (Scatter) graph of normalized brightness values corresponding to the radius squared. Then on the chart do Add Trendline and, in the Type tab, select Polynomial and Order 3; in the Options tab select "Display equation on chart" and "Display R-squared value on chart". Once you click OK, a regression line will be drawn through your scatter plot and an equation will show up on your graph.

This equation has the a, b, c, and d coefficient numbers we've been working toward. In my f/2.8 case, the regression equation produced was
y = -0.1355x3+0.0443x2-0.0943x+1.0873
The terms are in the reverse order of the fulla format so our a, b, c, and d coefficients for fulla are 1.0873, -0.0943, 0.0443, and -0.1355 respectively. The R
2 (squared coefficient of variation) value was 0.9963 in my case, which is a very good fit. (A R
2 of 1.0 represents a perfect fit while 0 represents no correlation whatsoever; the closer to 1.0 we get, the more confidence the regression line is a good representation of our measured data.)
So, why did we plot against radius squared rather than radius? It's because we need the even-numbered sixth-order polynomial which isn't available as an option in Excel so we finessed it by using a 3rd-order polynomial regression line against r
2.
If you don't have Excel, you may have access to another spreadsheet program with a similar regression analysis capability. If not, there are other programs such as statistical analysis packages that can do it, or you can even use online tools to accomplish the same thing. See for example
http://udel.edu/~mcdonald/statcurvreg.html and scroll down to the heading, "How to do the test" which has links to several online tools as well as a spreadsheet you can download for use when you don't have the integrated trend line feature.

Next we look at a quick test. This image is a composite of 2 images shot with a pan between to see how they match up. Notice the seam line where the two images line up. The vignetting is clearly visible. If we process the two images separately using the fulla tool, we can check how effective our calculations were. We use our calculated coefficients in fulla using the command like this:
fulla -c 1.0873:-0.0943:0.0443:-0.1355 image_file_name

When we composite the corrected images together in the same way as the originals, we see the seam is markedly less visible indicating our correction has improved the vignetting situation.
Is it perfect? Not at all. This method can cause color shifts because it's not actually correcting strictly luminance but rather just doing a crude adjustment of the RGB values in the image. It also uses assumptions of perfect radial behavior, an imperfect regression line, imperfect input test data, and so on. However, in most cases it is an improvement as we can see in the corrected image. Is it worth the trouble? Perhaps not for most images but once the calculations are done it can be applied nearly effortlessly to any image shot with the same camera, lens, focal length, and aperture combination such as what we're targeting here for our panoramas.
There are other more advanced techniques evolving that can guess at vignette correction, particularly in multi-image panorama environments and make adjustments accordingly. Of course there's the now-standard panorama tools Smartblend, Enblend, etc. that disguise vignette and other tonal anomalies.
Next up, we'll look at lens distortion and how we can correct that using fulla as well. We're working toward a single fulla command line to correct as many flaws as we can and when we're finished we'll put together some simple scripts to simplify correcting batches of images.